
Analytics for Humans Athletes
Re-live that epic race, final sprint, monster climb, or crazy set of intervals via Chapeau’s beautiful charts and maps. Deep dive into your personal bests and readily compare your progression over time.
Chapeau offers simple integration with data from your head-unit or watch.
Build out your full training history. Load historic data files into Chapeau through simple drag and drop – no file size limits, no file count limits, no limits. Sit back and watch as Chapeau builds your performance profile from your cycling and running metrics.

Powerhouse of Power Analysis
A single number does not define you! Chapeau offers in-depth view of past performance for speed, pace, power, and effective power. Lean into your personal bests to understand your consistency and strengths. Examine your FTP and Critical Power estimates to see how your power profile is changing over time.

Own your data
Take control of your data – visualize and trend your gains. Chapeau’s intuitive insights can help you adjust training, reach goals, and lead the pack.
Unearth your Training History
Tired of scrolling your history to try to find old training sessions? We were! Chapeau has a simple yet powerful way to search and find your training sessions based on distance, time, date, speed, power, cadence, heart rate, elevation gain, location, speed / pace bests, power bests, and more… all your data is available for search!
Estimate FTP and track fitness gains over time
You’ve invested in a power data now invest in automatic power metrics! Chapeau interrogates and analyzes your power data, finds your best efforts, estimates your FTP, and calculates your Critical Power based on power and effective power from real training.

Chapeau at a Glance

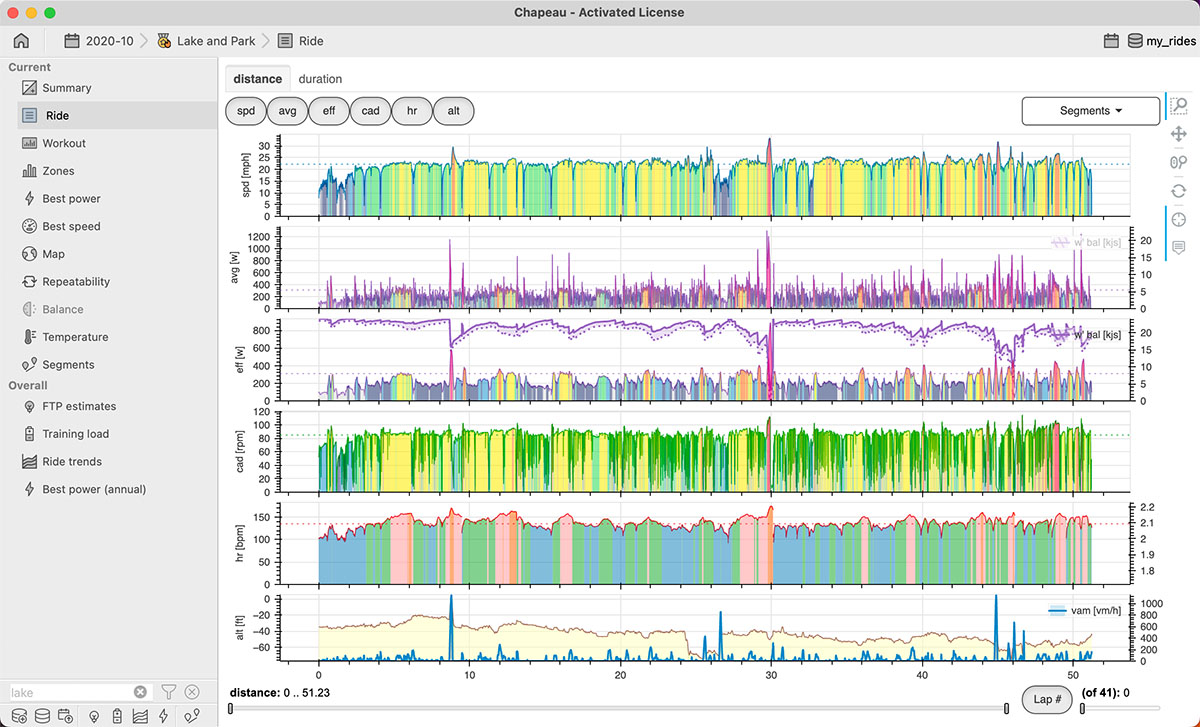
Session Chart
Quickly view session data for speed / pace, power, effective power, cadence / step rate, heart rate, and elevation. Includes advanced capability to view W’ Balance and Aerobic Efficiency. View individual laps and zoom to portions of the session. These charts have been carefully crafted show every data point of your session while also colorizing the curves by zones.

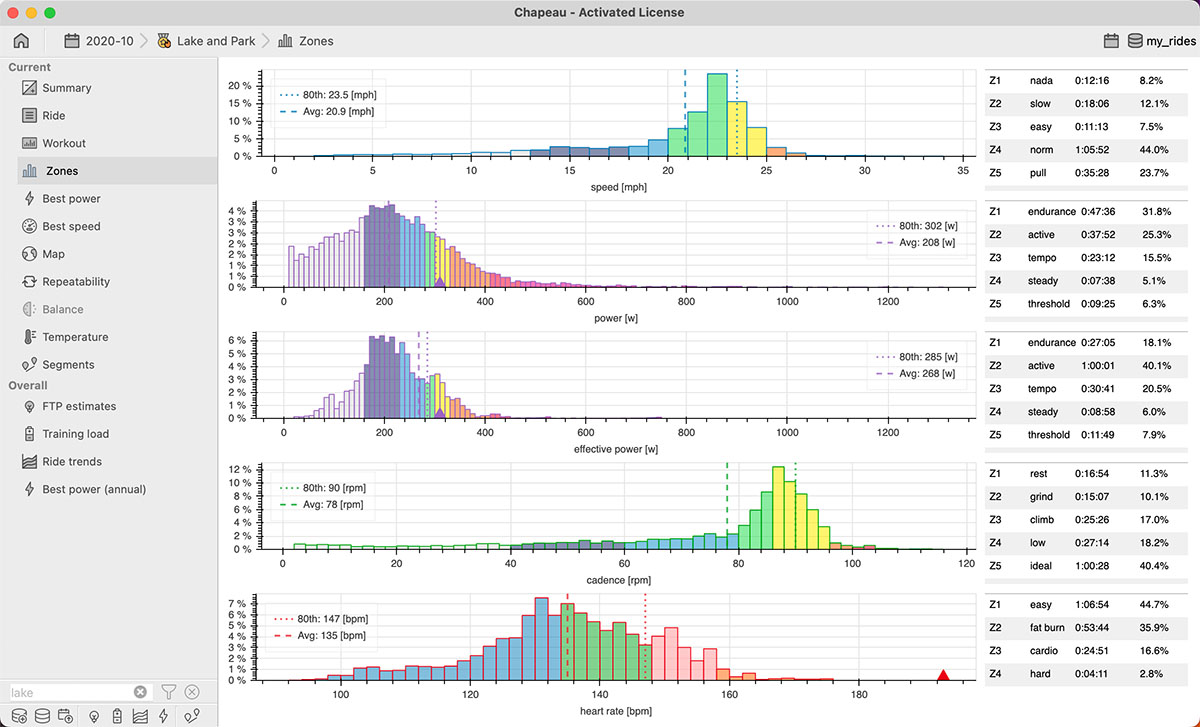
Zones
Summarized view of your session details. Access histograms of your speed / pace (and grade adjusted pace), power, effective power, and heart rate data alongside tables that summarize your time in each zone.

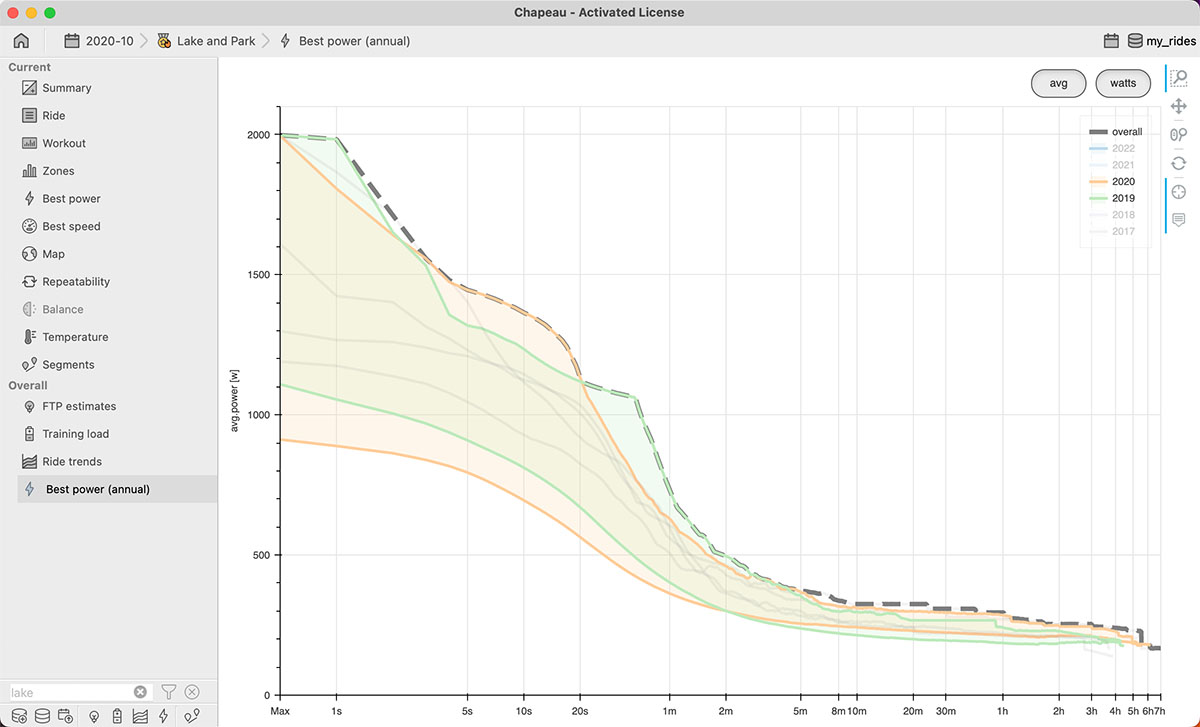
Critical Power
Uses an omni-domain power duration model to generate Critical Power (cp), Anaerobic Work Capacity (w’), and maximum power (p max). Calculations are automatic based on recent power bests or can be generated using selected intervals from specific timeframes. Visualize critical power alongside FTP estimates and on best power charts.

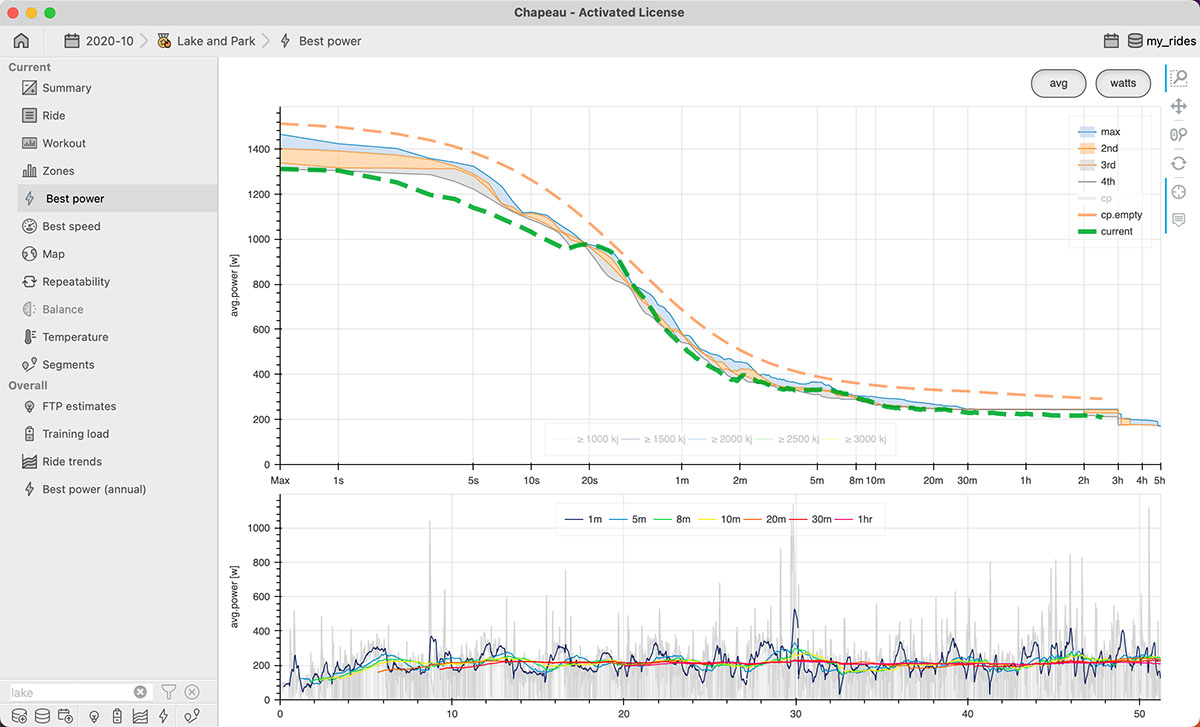
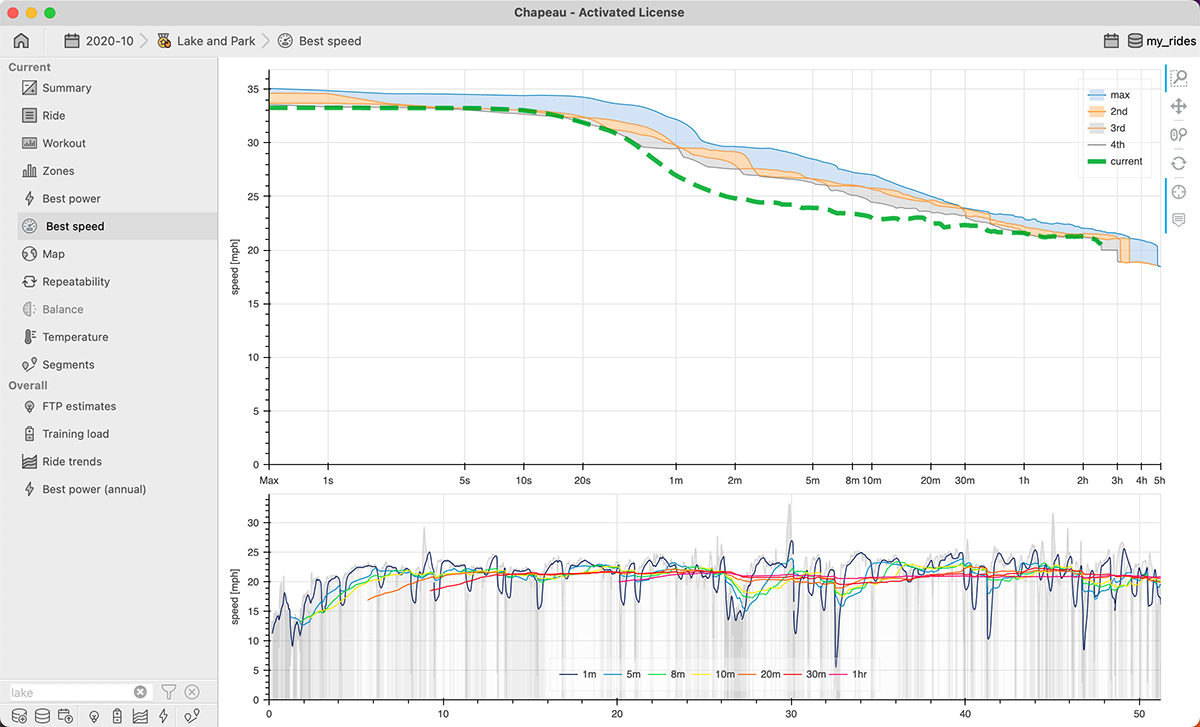
Bests
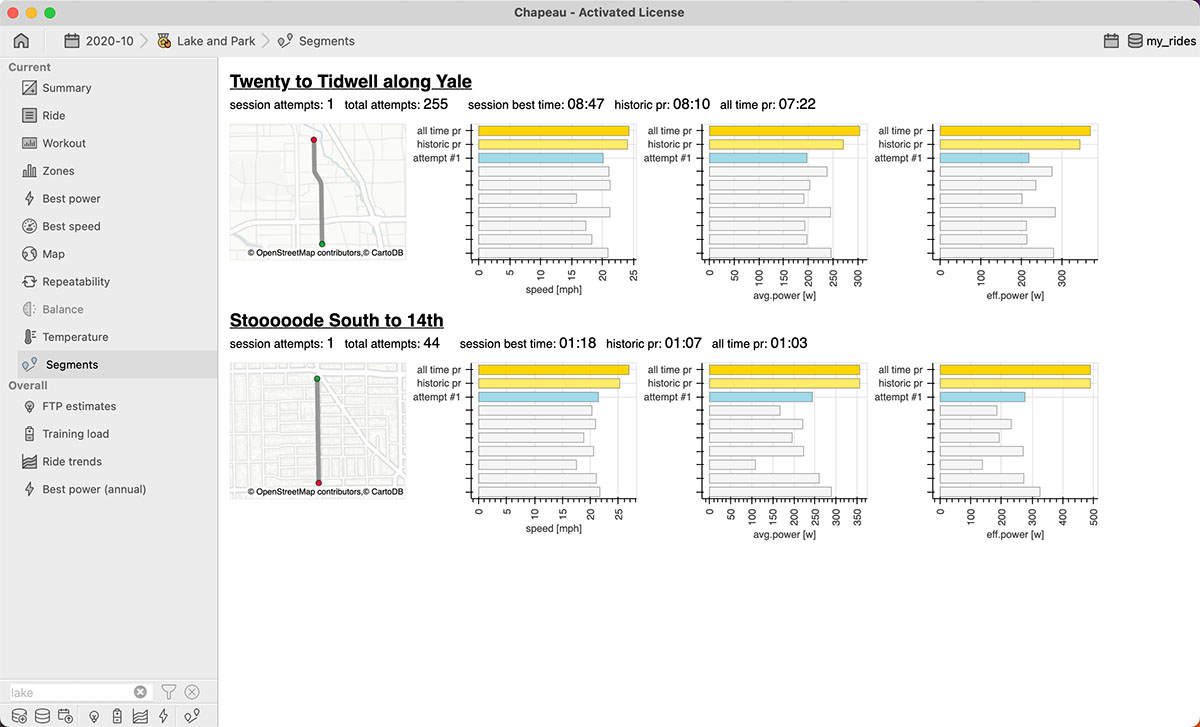
See your speed / pace, power, and effective power based on duration. These charts show your current session as well as your top rankings (top 4). Use these charts to view your current session against your rankings from the last six weeks of efforts.

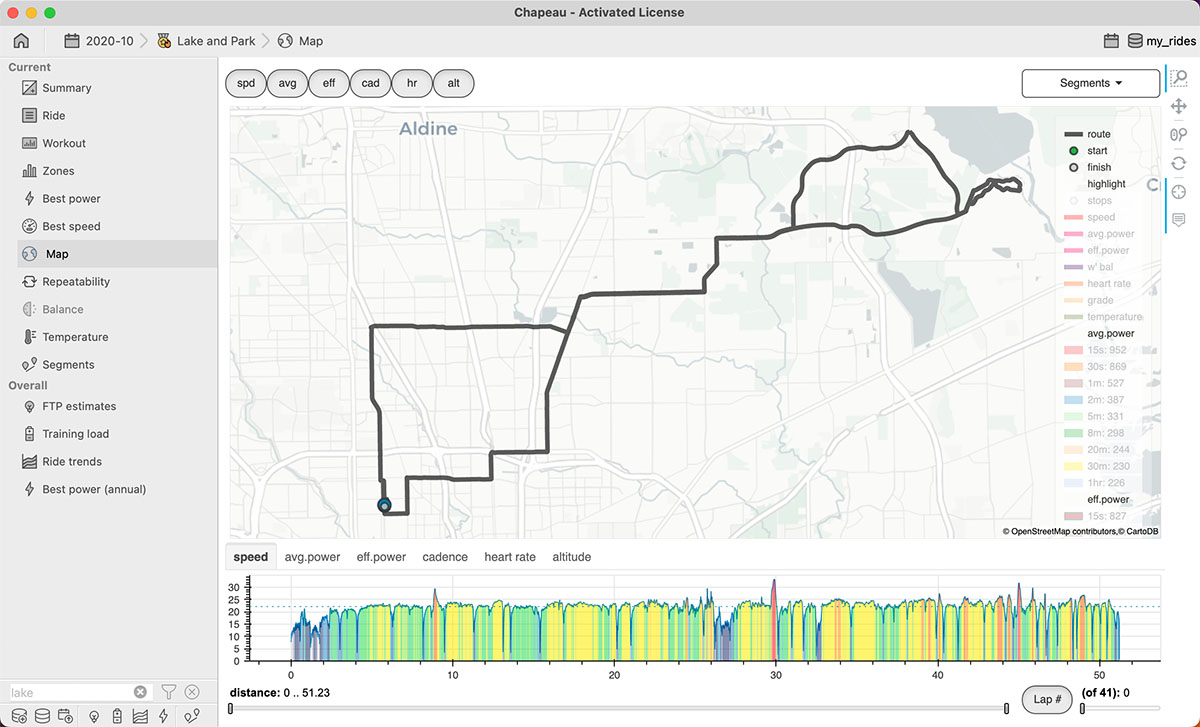
Map
This map has it all! Silky smooth interactions with your session charts, current power bests, speed / pace, temperature, W’ Balance, and power overlays. All the information you need for post-race analysis and for pre-race planning.

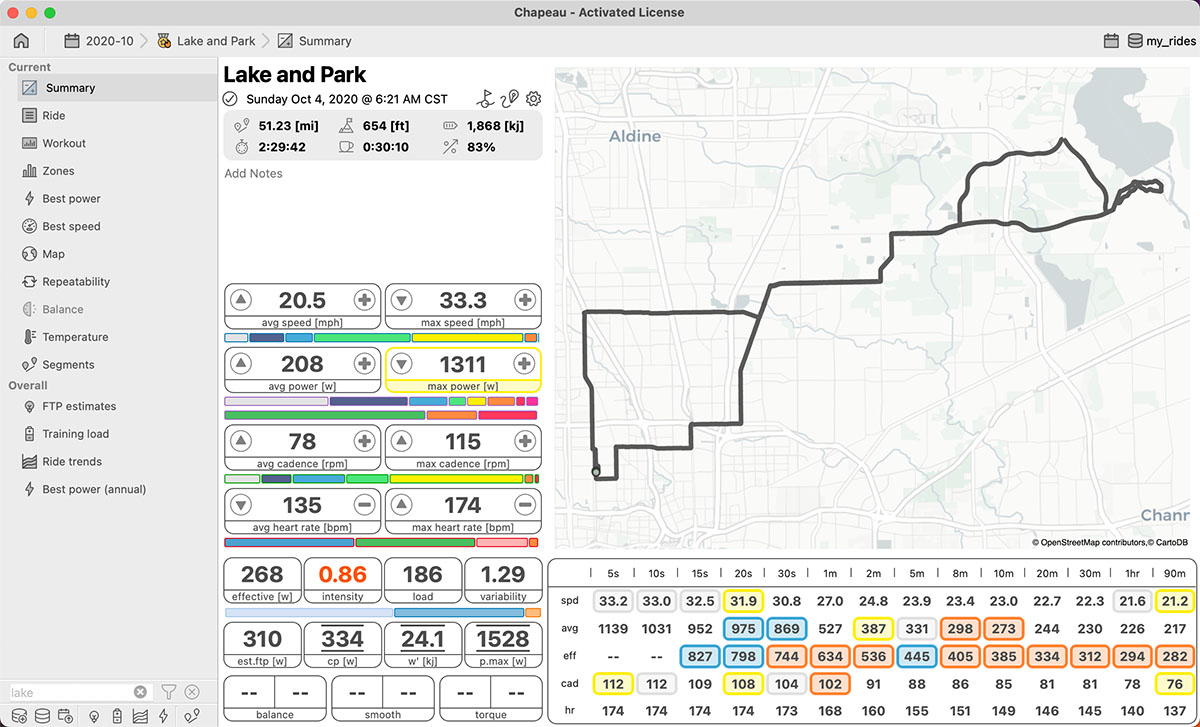
Monthly Summary
Comprehensive monthly summary showing totals for distance, elevation gain, move time, and kilojoules. Averages for metrics along with the low and high side values. Visualize time in zone for Speed, Power, Cadence, and Heart Rate and the routes travelled during the month.

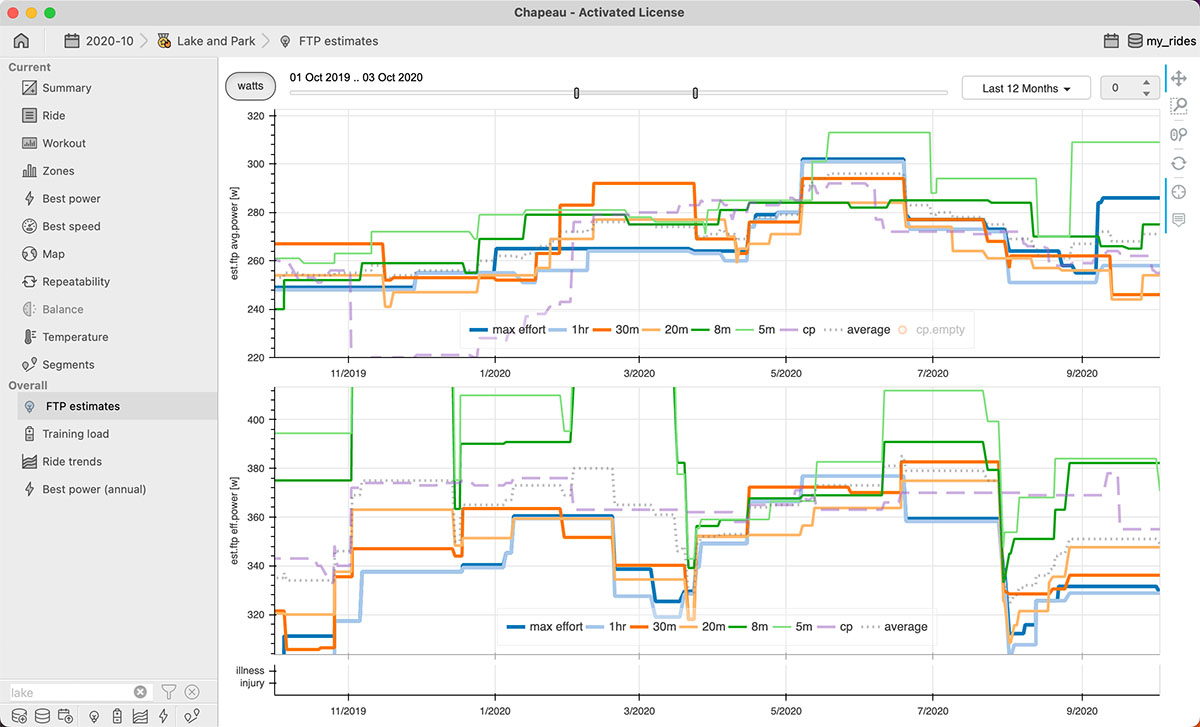
FTP estimates
An overall chart that trends your estimated FTP based on power and effective power. See your progression over the entirety of your cycling history or window into a specific timeframe or season. This chart shows the predicted values for FTP based on testing proxies and presents cleanly and clearly your FTP trend.

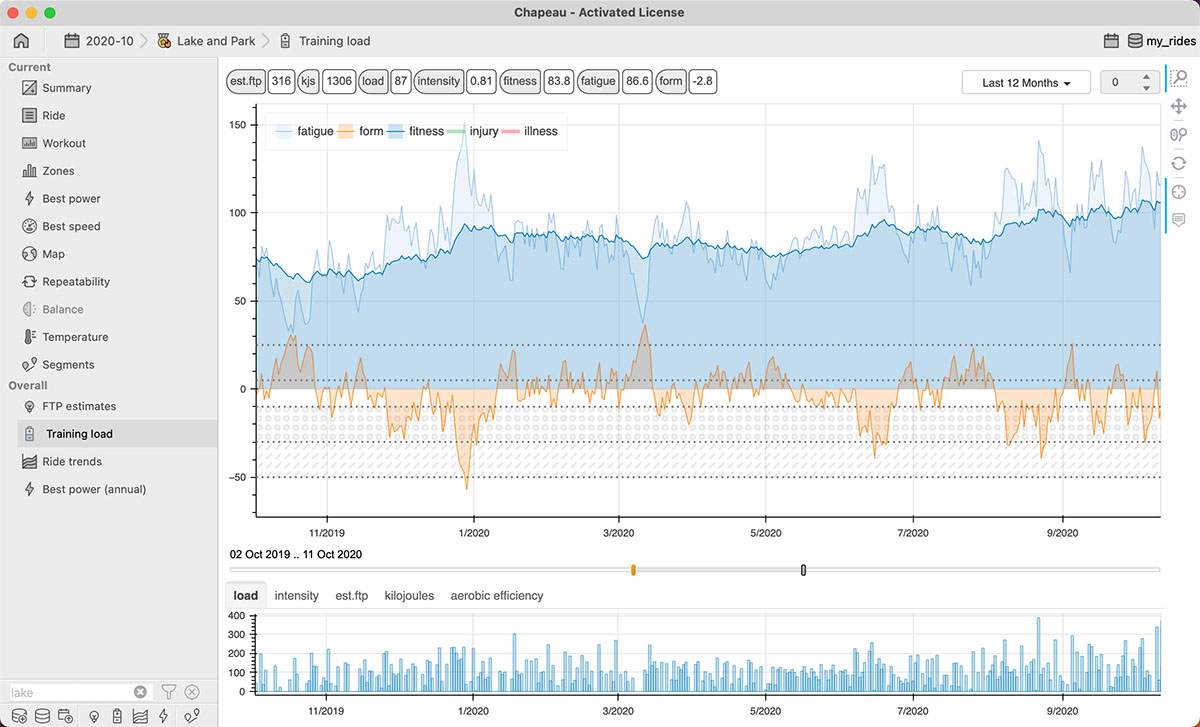
Training load
Overloaded? Over-reaching? Or ready to smash it? Use this chart to track your fitness, fatigue, and overall training load. A planning tool to save the legs for race day and to track your build phase and, just as important, your rest days.

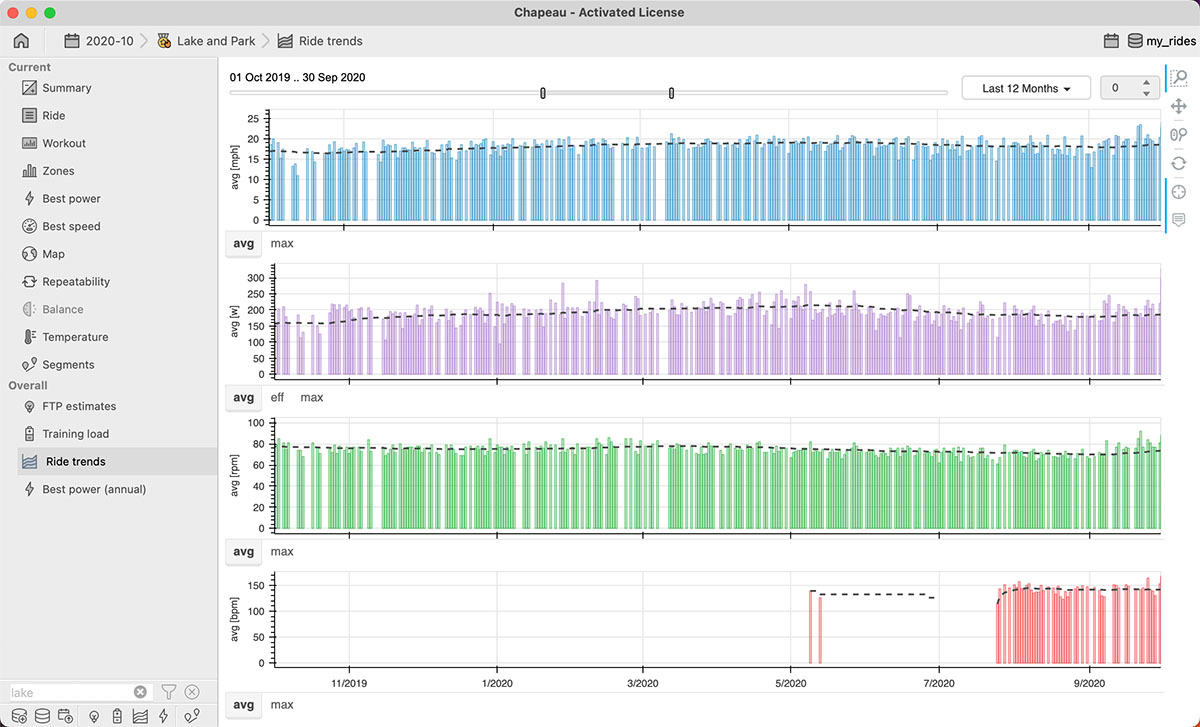
Session trends
All that data but are you getting better? Use this chart to inspect your speed / pace, power, cadence / step rate, and heart rate over your full training history. Included are trend lines based on daily data and a moving window – here is where you’ll see your performance improvements over time.

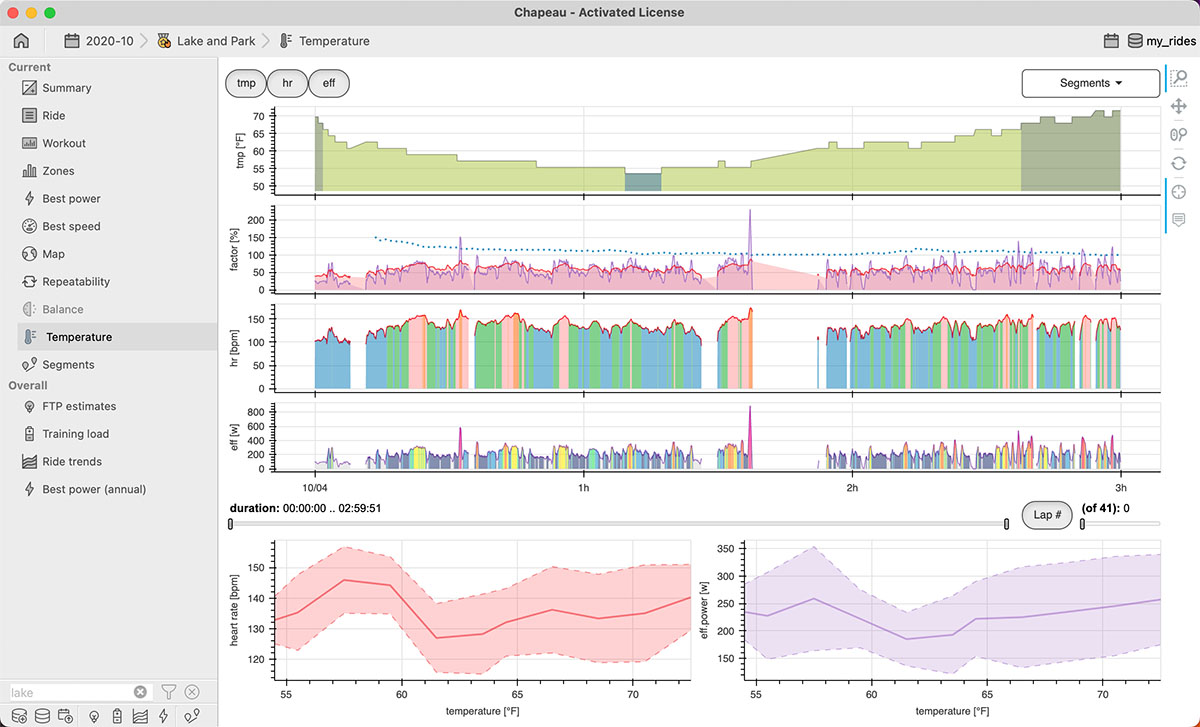
Temperature
Inspect your efforts against external temperature and/or core temperature. Gain insights into the effects of temperature on your heart rate and power output and visualize over the duration of your session.

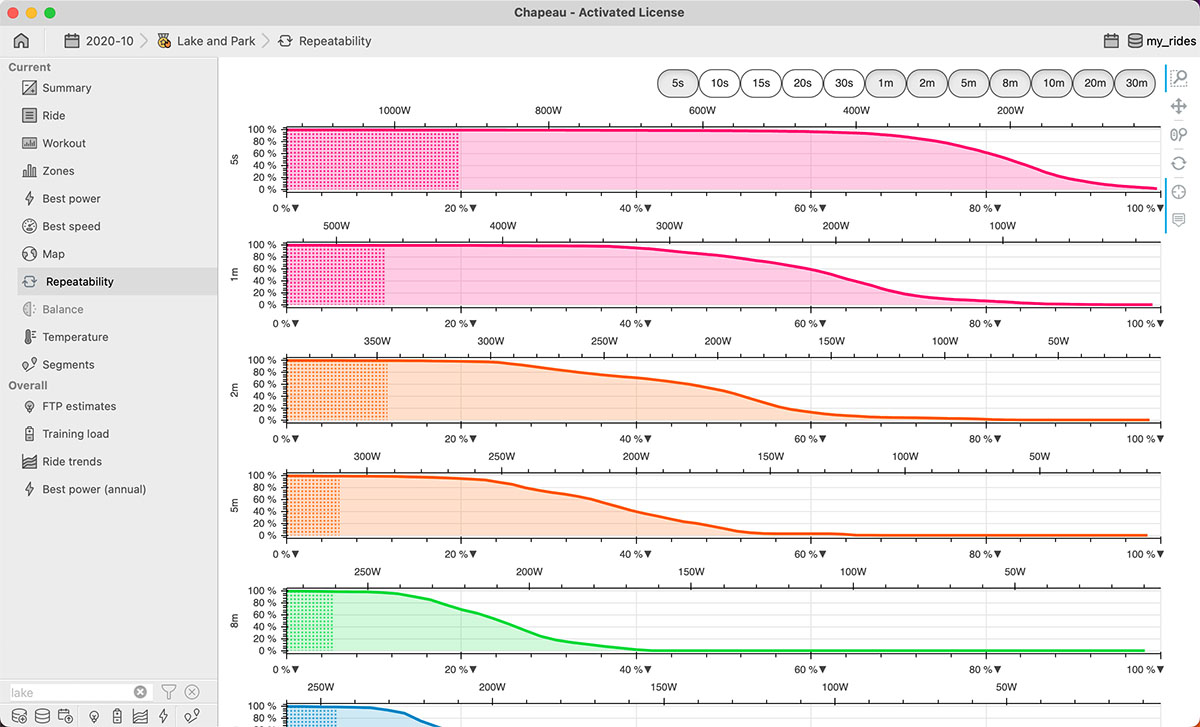
Fatigue Resistance
Sustained and repeatable power – easier said than done especially for long events. Visualize your power best curves based on energy and readily understand power drop with duration.

Aerobic Efficiency
Interactively measure the ratio of your intensity to effort and calculate Aerobic (de)coupling. Observe your Aerobic Efficiency over time to clearly see improvements in your fitness.